Rental Index

MIAC Rental Index

MIAC’s proprietary residential rental index provides granular and accurate rental revaluation for Buy-to-Let (“BTL”) properties in the UK. Launched in Sept 2015, the “MIAC Rental Index” offers unrivalled insight into rental values for BTL portfolio management. On average, 100,000 data points are analysed each month (Zoopla Property Group Ltd, © 2014). Measure back-book risk as per regulatory measurement of underwriting risk; keep the ICR’s dynamically updated in BTL portfolios. 
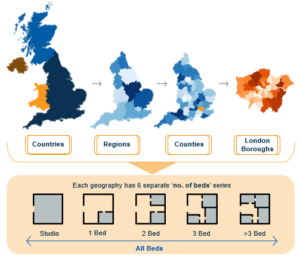
Unrivalled geographical and ‘no. of beds’ granularity; 1,128 separate index time series

Methodology

Outliers are identified across all dimensions, via statistical techniques (including winsorisation) and are removed in order to stabilise the maximum and minimum values over time for each aspect of the data. Outliers greater than the 99th percentile and lower than the 1st percentile are removed and these thresholds are monitored over time.

Granularity

The granularity of rental revaluation is down to the County and London Borough level. These geographies all contain additional number of beds specificity. This means a total of 1,128 time series to utilise for portfolio management.

Client Benefits

The revaluations provide a significant degree of detail versus the freely available regional indices. These are a valuable input to internal models and rating systems for an organisation with BTL mortgage assets seeking a deeper understanding of the rental income, and Interest Coverage Ratios (ICR), being generated by their landlord borrowers.

Rental Arithmetic

The index is mix adjusted for property type, number of beds, County/London Borough, Region and Country to ensure that change in the composition of the data over time does not skew the results. MIAC employs sophisticate

Underlying Data

The index is developed using Zoopla Property Group (“ZPG”) data for both asking prices and rent agreed contracts and is based at January 2012.
The quality of any index is highly dependent on the breadth and depth of underlying data used,
which is why this rental index utilises data from ZPG, the British property website. Zoopla monthly volumes can be tracked here. Approximately 100,000 data points are analysed each month to form the index. WhenFresh processed Zoopla Data is available to download on Sunday of every calendar Week.

Rental Index Monthly Summary Report

UK vs. London Rental Time Series

Comparison of rents and changes of London and UK rental values over time by index release date, varying time windows of aggregation, and number of beds.

The Average Rents of Inner/Outer London vs. the Rest of the UK

What is the relative Rents difference over Number of Beds

There is a counterintuitive bias for flats to be worth more than other property types within some countries. This is due to the fact that flats are generally located within the cities and therefore tend to be located within the more expensive areas within a given country.

What is the Distribution of Rents Over Time?