House Price Index

MIAC House Price Index

MIAC Analytics Ltd (“MIAC”) has redeveloped its House Price Index to disrupt the market and provide industry-leading residential indexing capability for lenders and financial services firms. The objectives of the model are the following: to reduce index-imposed volatility, reflect real-world market-based volatility, produce the most accurate HPI in the industry based on repeat sales back-testing , reduce the lag imposed by emerging data by utilising more real-time data, deliver an unrivalled transparency and model governance

Methodology

The model objectives are achieved via an innovative methodology derived after extensive research of the marketplace, testing multiple build methods, and MIAC’s deep heritage and experience in property-based indices, most recently the Rental Index which is licensed to major BTL lenders.
MIAC has developed a new approach called the “Interpolation of Matched Samples” methodology. The methodology mimics this concept to represent the market more accurately.

Granularity

The index series range is developed using all Land Registry (from 1995) and Registers of Scotland (from 2003) housing sale transactional data.
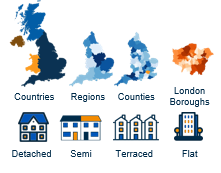
The potential granularity of valuation is down to the County and London Borough level inclusive of property type specificity. Therefore, the valuations provide a significant degree of detail versus the freely available regional indices and can be a valuable addition to internal models and rating systems for an organisation with Residential mortgage assets.

Monthly Issuance

Land Registry sales data is issued on the 20th working day of each month following the data month-end. Registers of Scotland data is released within the first few working days of the following month. Therefore, MIAC’s monthly issuance of the HPI will be by the 5th working day of the data month +1. For example, April 2019 index will be ready for issuance by working day 5 of June 2019. A lag of 1 month and 1 week.

Restatements

As with all indices, MIAC will restate its index when new or improved information emerges. Testing on restatement magnitude versus competitors has been favourable (in line with the fact that MIAC is the least volatile and most accurate). Such restatement is not expected to influence the UK level indices as much as more granular indices, and all restatement is expected to be industry-leading as a by-product of the methodology

Underlying Data

The data sources used to deliver this index are a combination of the following sources for
underlying data, geographical mapping, property, and address validation.
▪ Land Registry Sales Data (England & Wales)
▪ Registers of Scotland Data
▪ ONS Geographical Boundary Data
▪ Postcode Address File (“PAF”) via Royal Mail
▪ Internal Property Database (multiple sources) – only utilised for address and property
data validation

The Emergence of Land Registry Price Paid Data (PPD) Volumes over the Months and Years

We are continuing to monitor sales volumes closely and are implementing our routine checks for low volumes. We have hurdle rates in place to detect any volatility in sales volumes during our model build process and have relevant overrides to mitigate this. Given our current climate in the housing market, and that we are deviating from our normal (pre-Covid) process, we are benchmarking against 2019 volumes to inform us of any decisions we need to make in order to build a reliable index. The Land Registry’s monthly volumes are compared with the monthly property transactions reported by the HM Revenue and Customs (HMRC). The matrix below shows the index release date in the rows and the transaction month in the columns, so that entry aij gives the number of transactions that happened in month j  that were captured within the index published in the month i.

House Price Index Monthly Summary Report

UK vs. London House Price Index Time Series

Comparison of prices and changes of London and UK house prices over time by index release date, varying time windows of aggregation and property type

The Average House Price of Inner/Outer London and the Rest of the UK

What is the relative price difference over property type

There is a counterintuitive bias for flats to be worth more than other property types within some countries. This is due to the fact that flats are generally located within the cities and therefore tend to be located within the more expensive areas within a given country.

What is the Distribution of Transaction Values Over Time?

The Distribution of Transaction Values Over Time explores the temporal variation in transaction values, with an upper percentile representing the higher end of price ranges and a lower percentile capturing the lower end. Prices are grouped into distinct buckets or ranges to visualize how these transactions evolve across different price brackets throughout time.

What is the distribution of sale prices across the UK?

Iillustrating the spread and variation of property sale prices throughout the United Kingdom, utilizing percentiles to provide a comprehensive overview of pricing trends.